

Management Systems for Moroccan Agriculture 🌱 "detect pests and diseased leaves 🍃"
DATAFTOUR INITIATIVE BY MDS COMMUNITY


Table of Contents:
Introduction
Data Collection and Preparation
Importing Libraries and Loading Data
Data Preprocessing
Data Augmentation
Building the CNN Model
Model Architecture
Compiling the Model
Training the Model
Model Evaluation
Performance Metrics
Visualizing Training History
Model Deployment
Conclusion
INTRODUCTION:
Agricultural 🌱 practices play a crucial role in ensuring global food security. However, the health of crops can be significantly impacted by various factors, including the presence of diseases. One such crop of immense importance is the potato, a staple food for many populations around the world. Potatoes are susceptible to diseases such as Early Blight, Late Blight, and can also exhibit a healthy state.
In this context, leveraging advanced technologies becomes imperative to efficiently monitor and manage the health of potato crops. Deep learning, particularly Convolutional Neural Networks (CNNs), has shown remarkable success in image recognition tasks. This project focuses on utilizing CNNs for the detection and classification of diseases in potato leaves, specifically targeting Early Blight, Late Blight, and Healthy states.
We will build a web application to predict the diseases of Potato plants.
*This application will help farmers to identify the diseases in potato plants so that they can use appropriate fertilizers to get more yield.*We will build a web application to predict the diseases of Potato plants.
This application will help farmers to identify the diseases in potato plants so that they can use appropriate fertilizers to get more yield.
Image Classification
A classical computer vision problem, where the task is to predict the class of an image within a known set of possible classes.
Problem statement
To classify the given potato leaf image as healthy, late blight or early blight.
It is a multi class classification problem.
Data
We will use a kaggle dataset for this project.
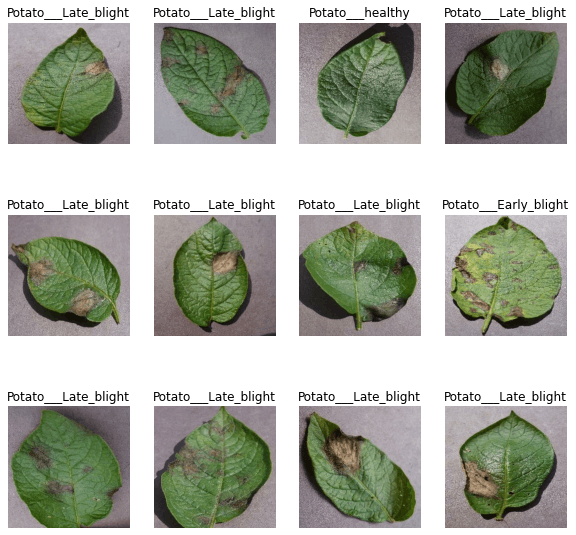
I created a subset of the original data, which includes only the diseases of potato plants. You can find the dataset used in this project
Late Blight: Late blight of potato is a disease caused by fungus Phytophthora infestans.
Early Blight: Early blight of potato is a disease caused by the fungus Alternaria solani
Healthy: Uninfected or healthy plant
Data Collection and Preparation
Importing Libraries and Loading Data
involves importing the necessary libraries for the project, such as TensorFlow and Matplotlib, and loading the dataset of potato images, it ensures that all required dependencies are available and accessible for further processing.
import tensorflow as tf
from tensorflow.keras import models, layers
import matplotlib.pyplot as plt
This part imports the necessary libraries, including TensorFlow and Matplotlib, and loads the datasets of potato images using TensorFlow's image_dataset_from_directory function.
Data Preprocessing
Data preprocessing involves preparing the dataset for model training by performing operations such as resizing, normalization, and batching. This section ensures that the data is in the appropriate format and structure for training the CNN model.
IMAGE_SIZE = 256
BATCH_SIZE = 32
CHANNELS = 3
EPOCHS = 50
Defines constants for image size, batch size, number of color channels, and number of epochs.
Data Augmentation
Data augmentation is a technique used to artificially increase the diversity of the training dataset by applying transformations such as rotation, flipping, and scaling to the images. This helps the model generalize better and improves its performance on unseen data.
data_augmentation = tf.keras.Sequential([
    layers.experimental.preprocessing.RandomFlip("horizontal_and_vertical"),
    layers.experimental.preprocessing.RandomRotation(0.2)
])
Building the CNN Model
Model Architecture
The model architecture defines the structure and configuration of the CNN model, including the number and type of layers, their activation functions, and their connectivity. It lays the foundation for the neural network's ability to learn and make predictions based on input data.
input_shape = (BATCH_SIZE, IMAGE_SIZE, IMAGE_SIZE, CHANNELS)
n_classes = 3
model = models.Sequential([
resize_and_rescale,
data_augmentation,
layers.Conv2D(32, kernel_size=(3,3), activation='relu', input_shape=input_shape),
layers.MaxPooling2D((2, 2)),
layers.Conv2D(64, kernel_size=(3,3), activation='relu'),
layers.MaxPooling2D((2, 2)),
layers.Conv2D(64, kernel_size=(3,3), activation='relu'),
layers.MaxPooling2D((2, 2)),
layers.Conv2D(64, (3, 3), activation='relu'),
layers.MaxPooling2D((2, 2)),
layers.Conv2D(64, (3, 3), activation='relu'),
layers.MaxPooling2D((2, 2)),
layers.Conv2D(64, (3, 3), activation='relu'),
layers.MaxPooling2D((2, 2)),
layers.Flatten(),
layers.Dense(64, activation='relu'),
layers.Dense(n_classes, activation='softmax'),
])
model.build(input_shape=input_shape)
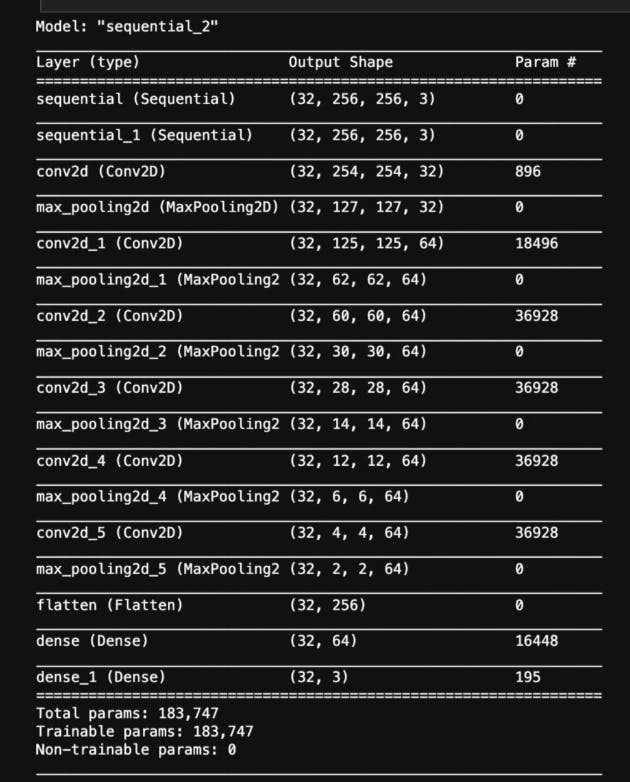
model.summary()
Defines the architecture of the CNN model using TensorFlow's Sequential API.
The next step is to investigate model architecture.
Let’s have a look at the brief summary of our mode
Compiling the Model
Compiling the model involves configuring its learning process by specifying the optimizer, loss function, and evaluation metrics. This step prepares the model for training by defining how it should update its parameters to minimize the loss and improve performance.
model.compile(
    optimizer='adam',
    loss=tf.keras.losses.SparseCategoricalCrossentropy(from_logits=False),
    metrics=['accuracy']
)
Compiles the model with the Adam optimizer, sparse categorical crossentropy loss function, and accuracy metric.
Training the Model
Training the model involves feeding the training dataset into the neural network and iteratively adjusting its parameters to minimize the loss function. This process allows the model to learn from the data and improve its ability to make accurate predictions.
history = model.fit(
    train_ds,
    batch_size=BATCH_SIZE,
    validation_data=val_ds,
    verbose=1,
    epochs=EPOCHS,
)
Trains the model on the training dataset and evaluates its performance on the validation dataset.
Model Evaluation
Model evaluation involves assessing the performance of the trained model on separate validation and test datasets. It provides insights into how well the model generalizes to unseen data and helps identify areas for improvement
scores = model.evaluate(test_ds)
Evaluates the model on the test dataset and prints the evaluation scores.
Performance Metrics
Performance metrics are quantitative measures used to evaluate the effectiveness of the trained model. Common metrics include accuracy, precision, recall, and F1 score, which provide information about the model's classification performance.
history.history.keys()
Prints the keys available in the history object, which contains training and validation metrics.
Visualizing Training History
Visualizing the training history involves plotting graphs of training and validation metrics, such as accuracy and loss, over the course of training epochs. This visualization helps identify trends, patterns, and potential issues in the model's learning process.
plt.plot(range(EPOCHS), acc, label='Training Accuracy')
plt.plot(range(EPOCHS), val_acc, label='Validation Accuracy')
plt.title('Training and Validation Accuracy')
plt.legend(loc='lower right')
plt.show()
Plots the training and validation accuracy over epochs to visualize the model's learning progress.
Let’s have a look at the history parameter.
Actually, history is a Keras callback that keeps all epoch history as a list; let’s utilize it to plot some intriguing plots. Let’s start by putting all of these parameters into variables.
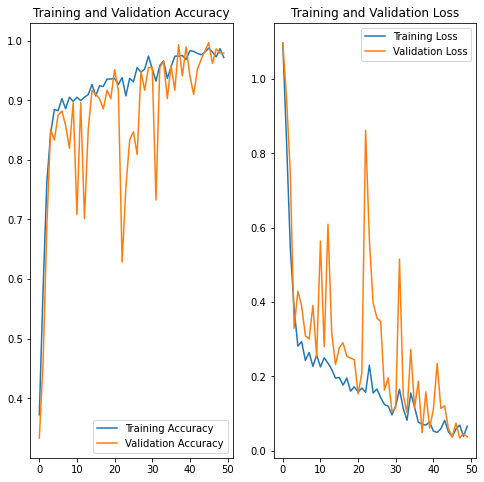
This graph shows the accuracy of training vs validation. Epochs are on the x-axis, and accuracy and loss are on the y-axis.
Let's save our model
# it will save the model
model.save('final_model.h5')
Model Deployment
Saving the Model
Saving the model involves exporting its architecture and trained weights to a file for future use or deployment. This allows the model to be easily loaded and used in other applications without needing to retrain it from scratch.
model.save("potato_model.h5")
Saves the trained model to a file for future use or deployment.
Streamlit – The Boom!
Streamlit is a free, open-source Python Framework, that allows us to quickly develop a Web Application without the requirement of a backend server and without having to write HTML, CSS, or Javascript. We can start building a really good Web Application simply by using our existing python skills. I’ve created a simple web application that accepts images as input and requires the same preprocessing steps on the input image as we did on our training dataset during training because when we save our model, it only saves model trained parameters, and we must preprocess our input manually, so this is something we must keep in mind when building any web application or using a pre-trained model.
Web App
import streamlit as st
from PIL import Image
import numpy as np
import tensorflow as tf
from werkzeug.utils import secure_filename
import os

os.environ["CUDA_VISIBLE_DEVICES"] = "-1"

class_names = ['Potato___Early_blight', 'Potato___Late_blight', 'Potato___healthy']

def predict(model, img):
    img_array = tf.keras.preprocessing.image.img_to_array(img)
    img_array = tf.expand_dims(img_array, 0)
    predictions = model.predict(img_array)
    predictions_arr = [round(100 * i, 2) for i in predictions[0]]
    predicted_class = class_names[np.argmax(predictions[0])]
    confidence = round(100 * (np.max(predictions[0])), 2)
    return predicted_class, predictions_arr

model = tf.keras.models.load_model('potato_model.h5', compile=False)

def main():
    st.set_page_config(page_title="Potato Disease Classifier")
    st.sidebar.title("Potato Disease Classifier")
    st.sidebar.info("Upload an image of a potato leaf to detect early or late blight.")
    st.title("Potato Disease Detection")
    uploaded_file = st.file_uploader("Upload a potato leaf image",type=['jpg','png','jpeg'])
    if uploaded_file is not None:
        image = Image.open(uploaded_file)
        st.image(image,caption="Uploaded Image",use_column_width=True)
        image = image.resize((256,256))
        img_arr = np.array(image)
        predicted_class,predictions=predict(model,img_arr)

        response = {
            "predicted_class": predicted_class,
            "early": f"{predictions[0]:.2f}%",
            "late": f"{predictions[1]:.2f}%",
            "healthy": f"{predictions[2]:.2f}%"
        }


        st.success(f"Predicted Class : {response['predicted_class']}",icon="✅")
        st.write("Probabilities:")
        col1,col2,col3 = st.columns(3)
        col1.metric("Early Blight" , f"{response['early']}", f"{response['early']}")
        col2.metric("Late Blight" , f"{response['late']}", f"{response['late']}")
        col3.metric("Healthy" , f"{response['healthy']}", f"{response['healthy']}")

if __name__ == "__main__":
    main()
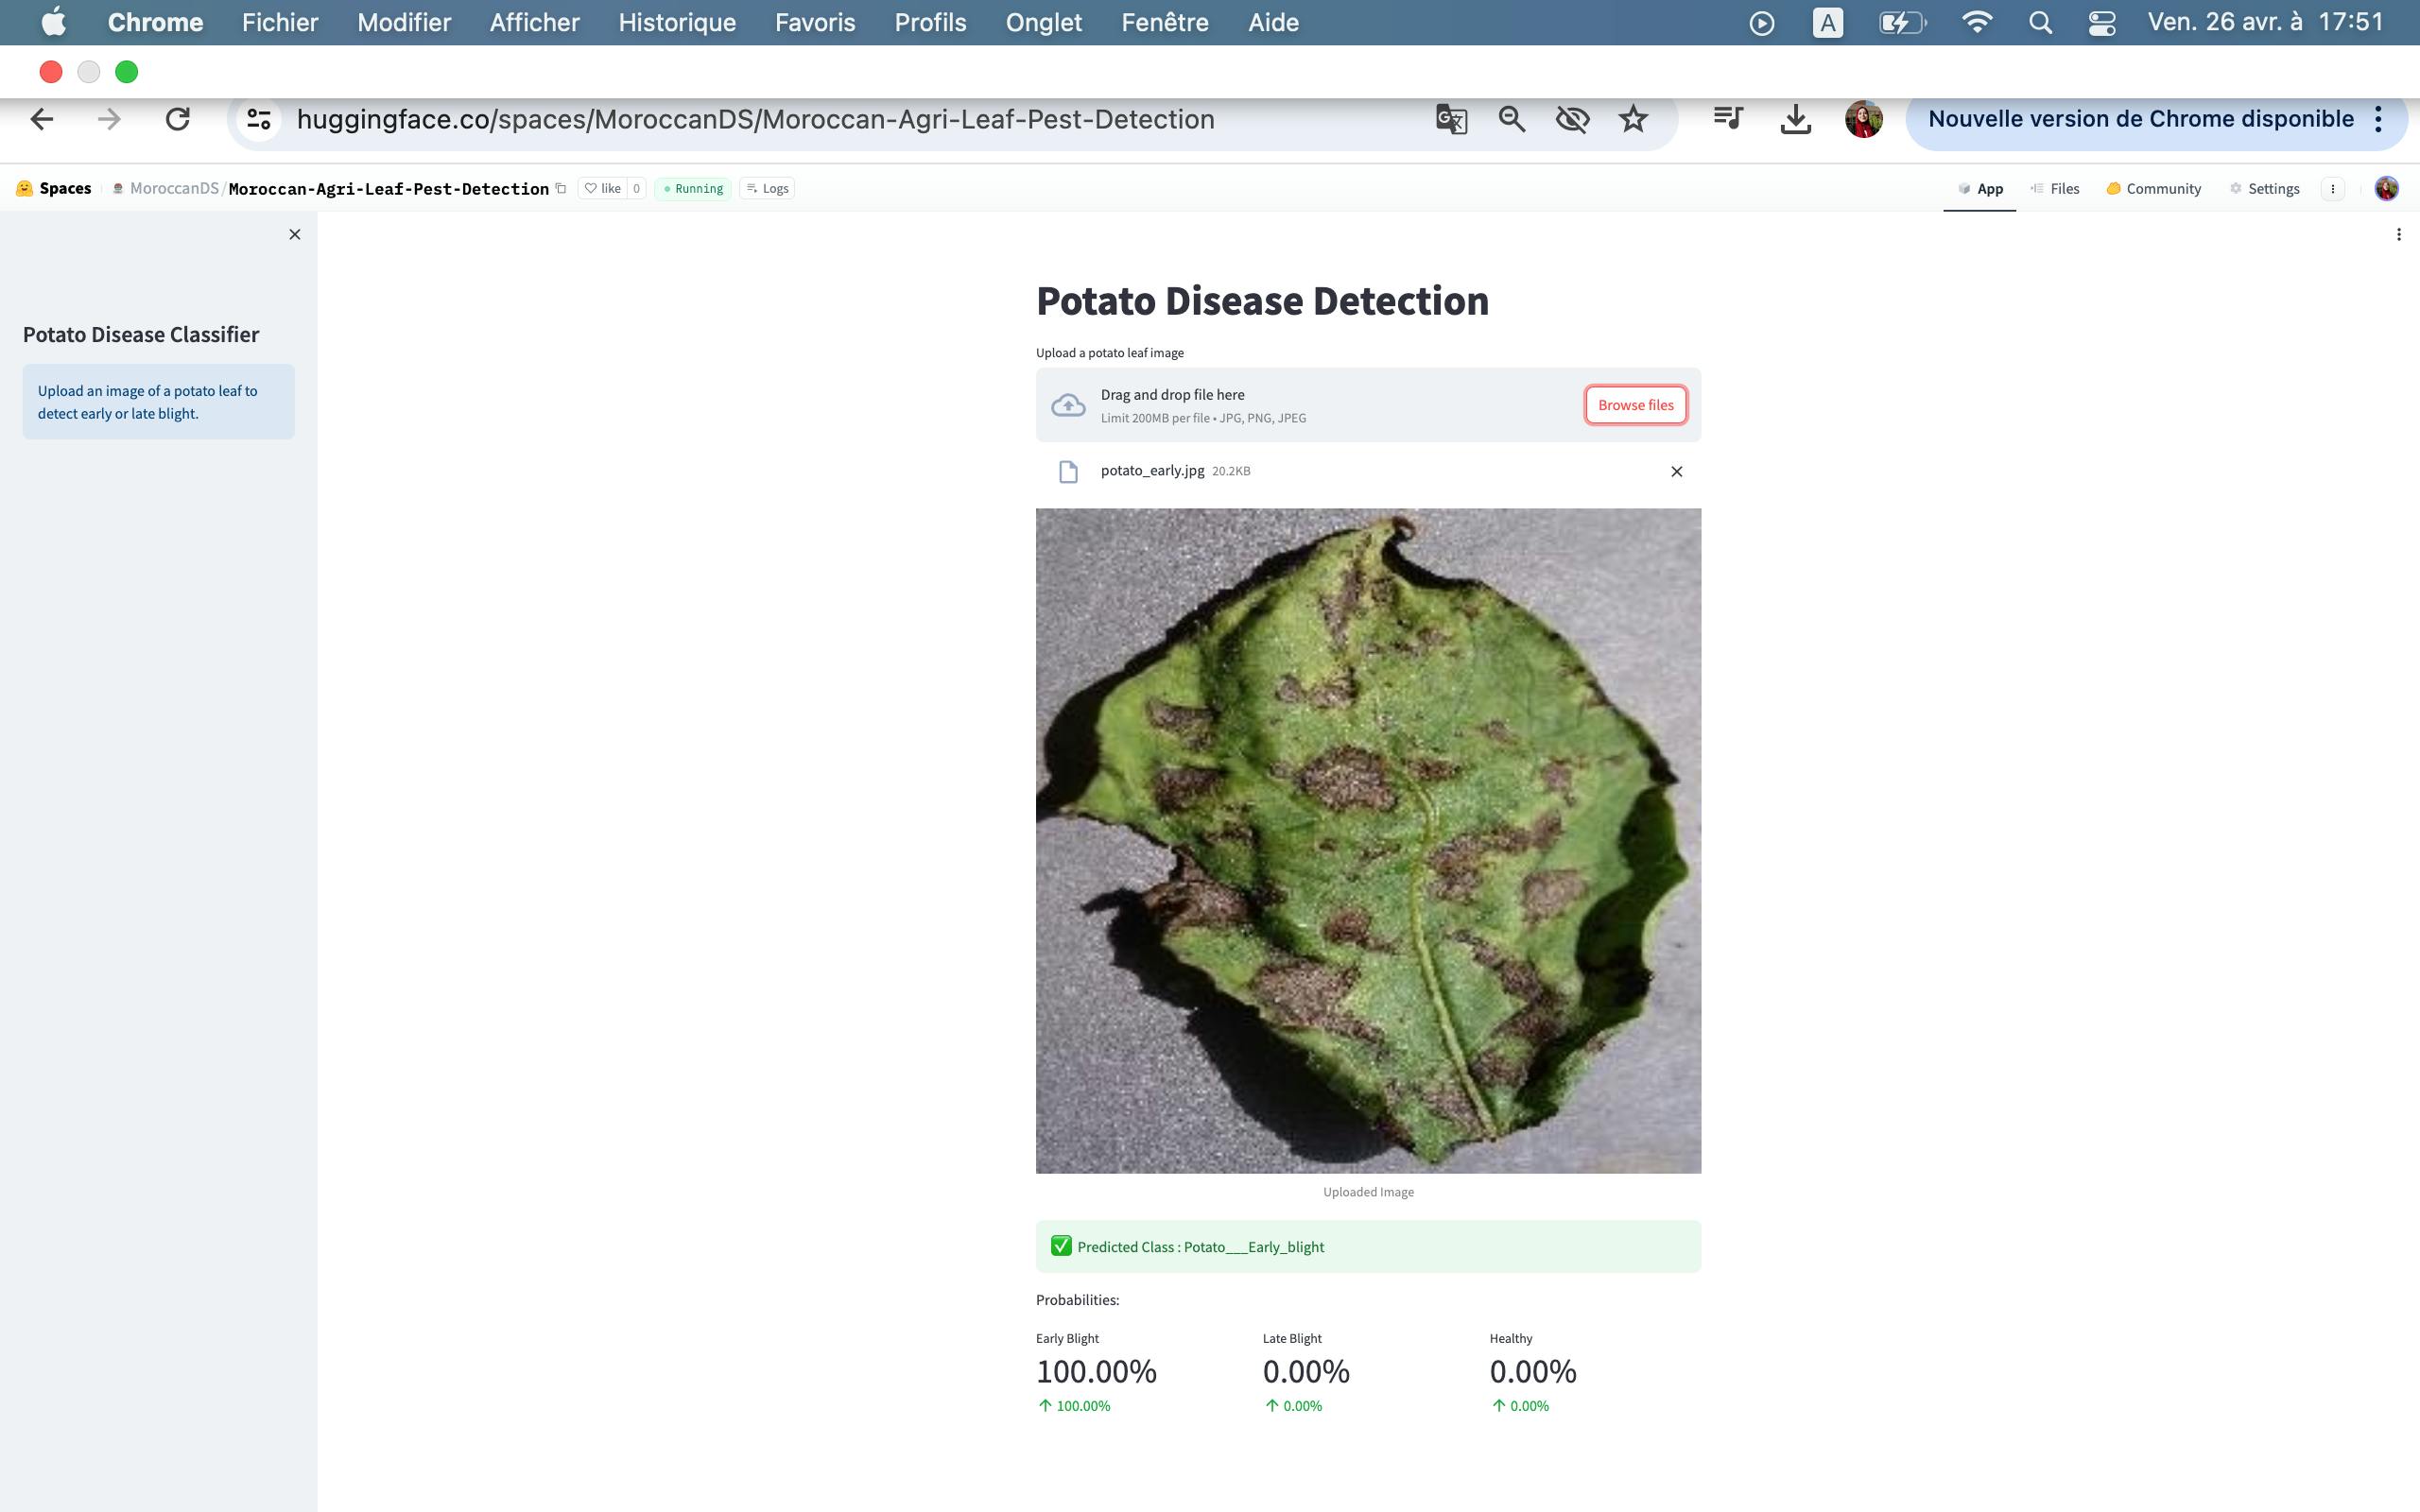
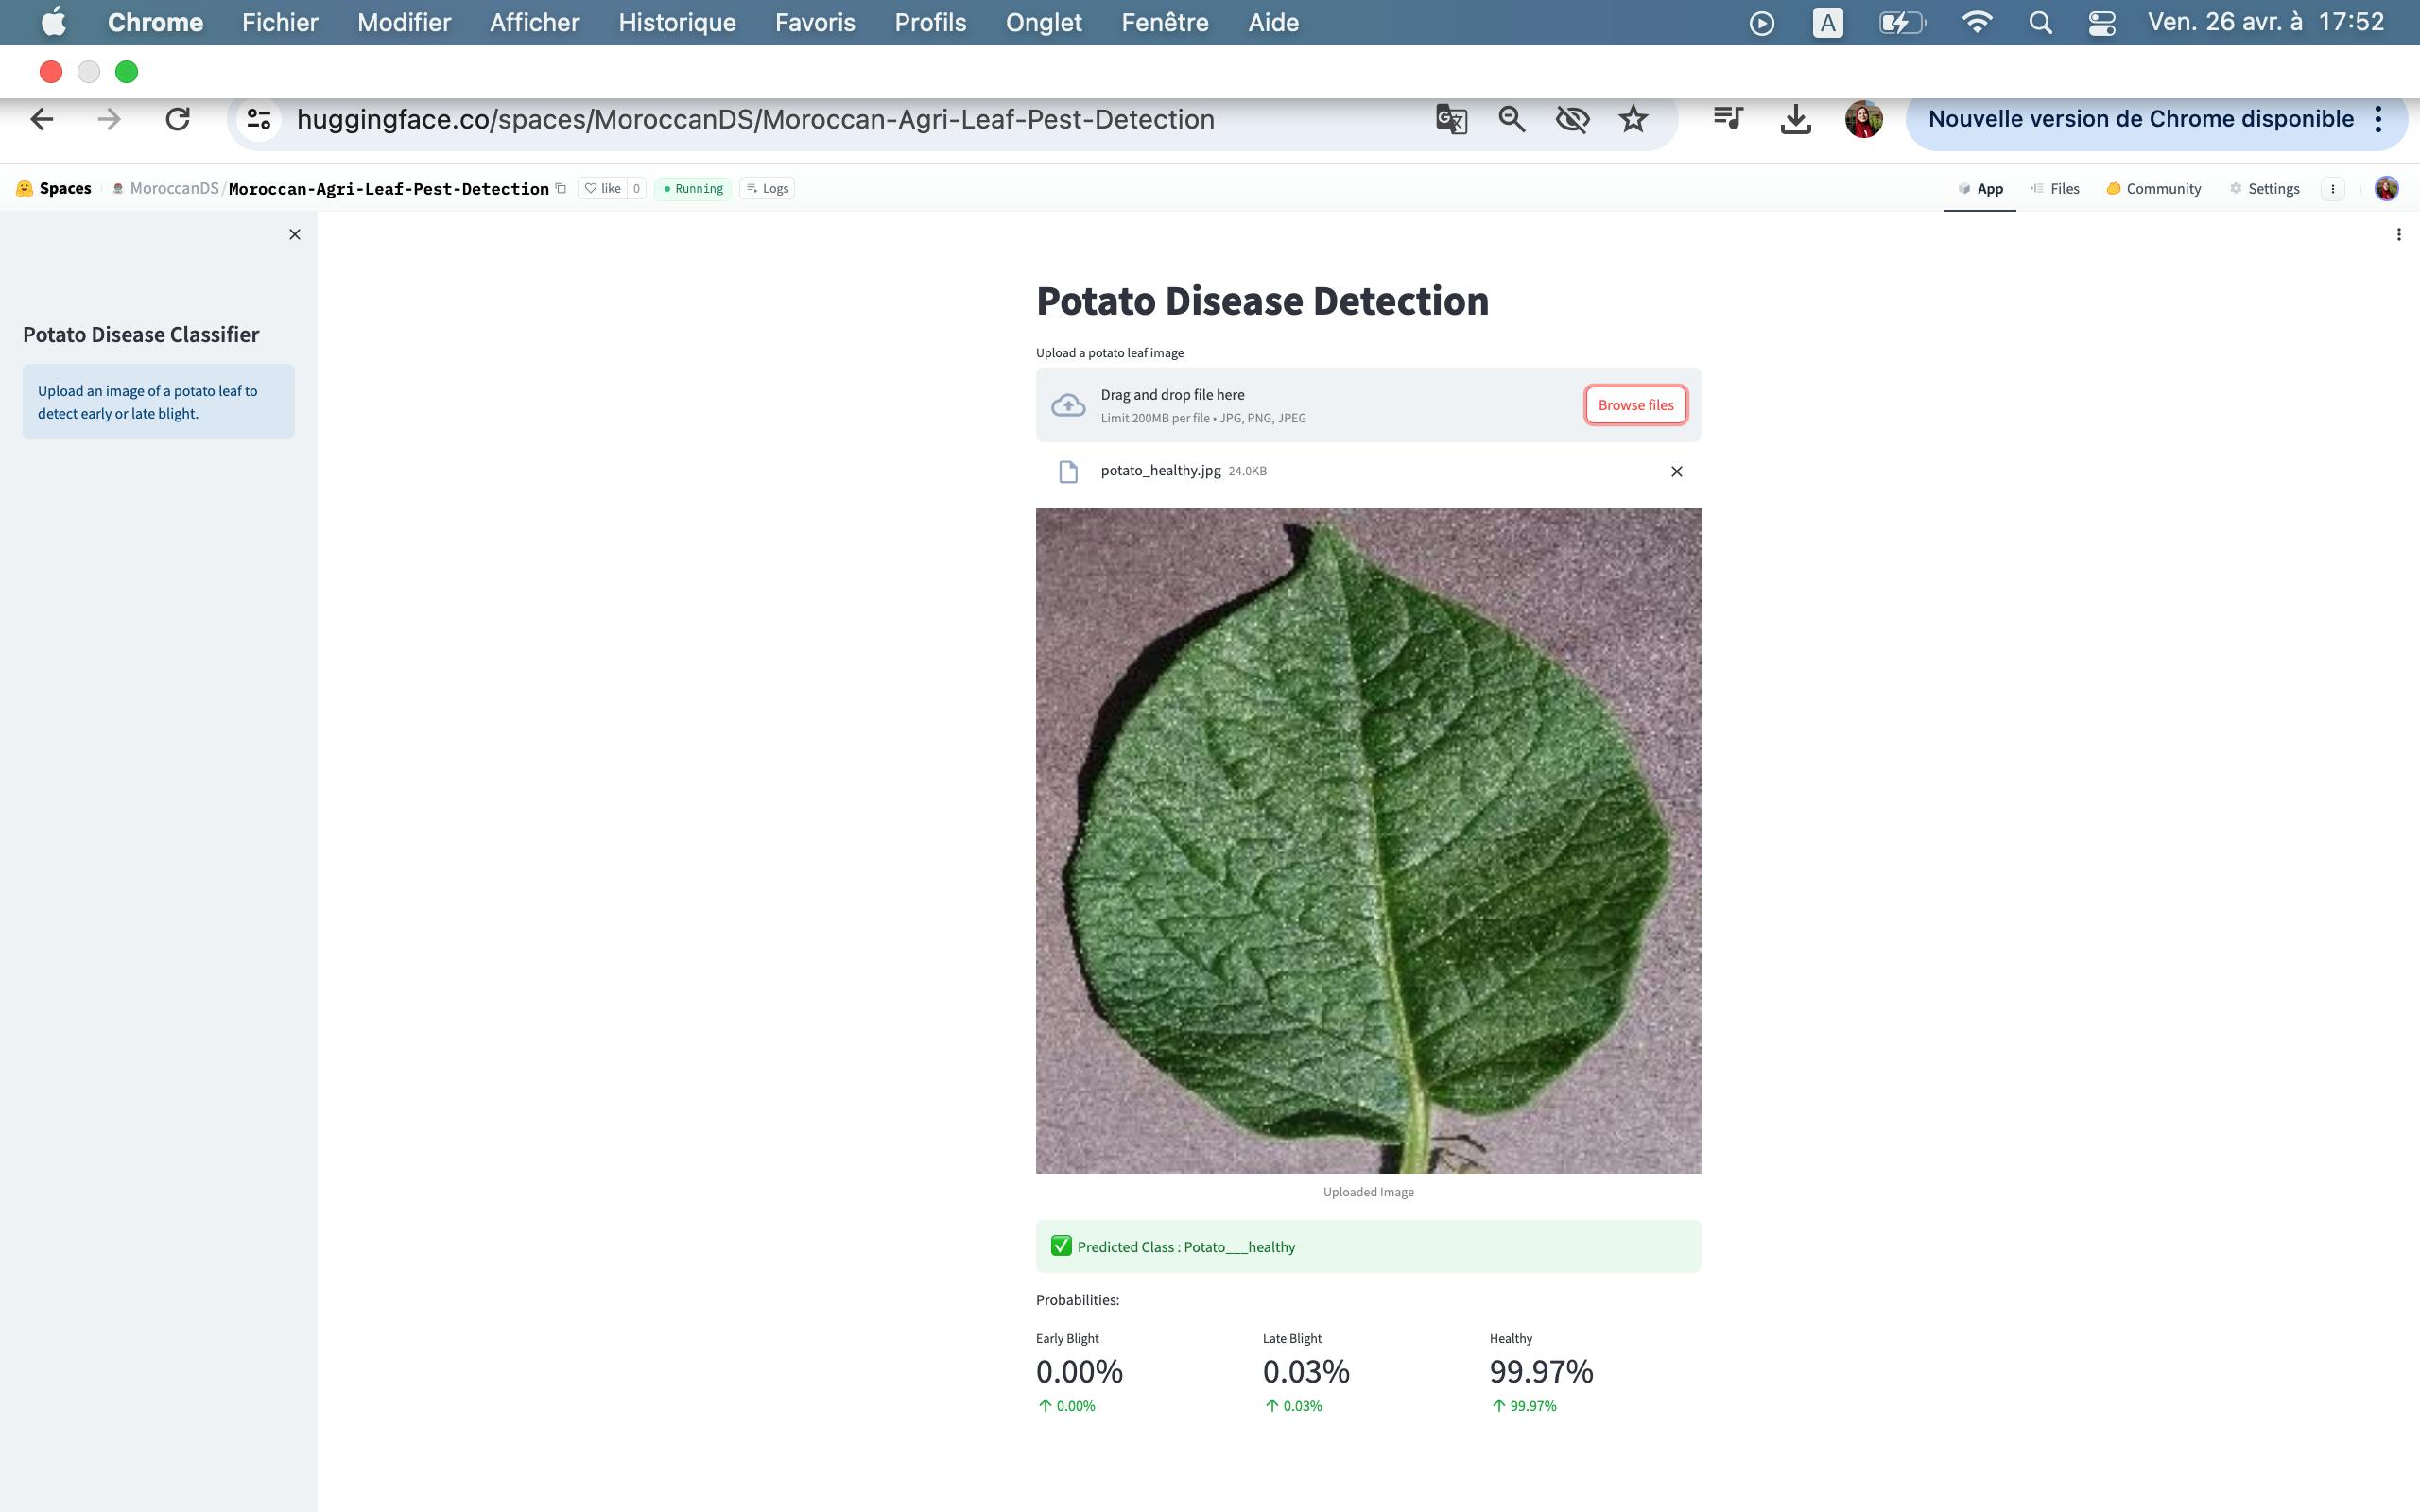
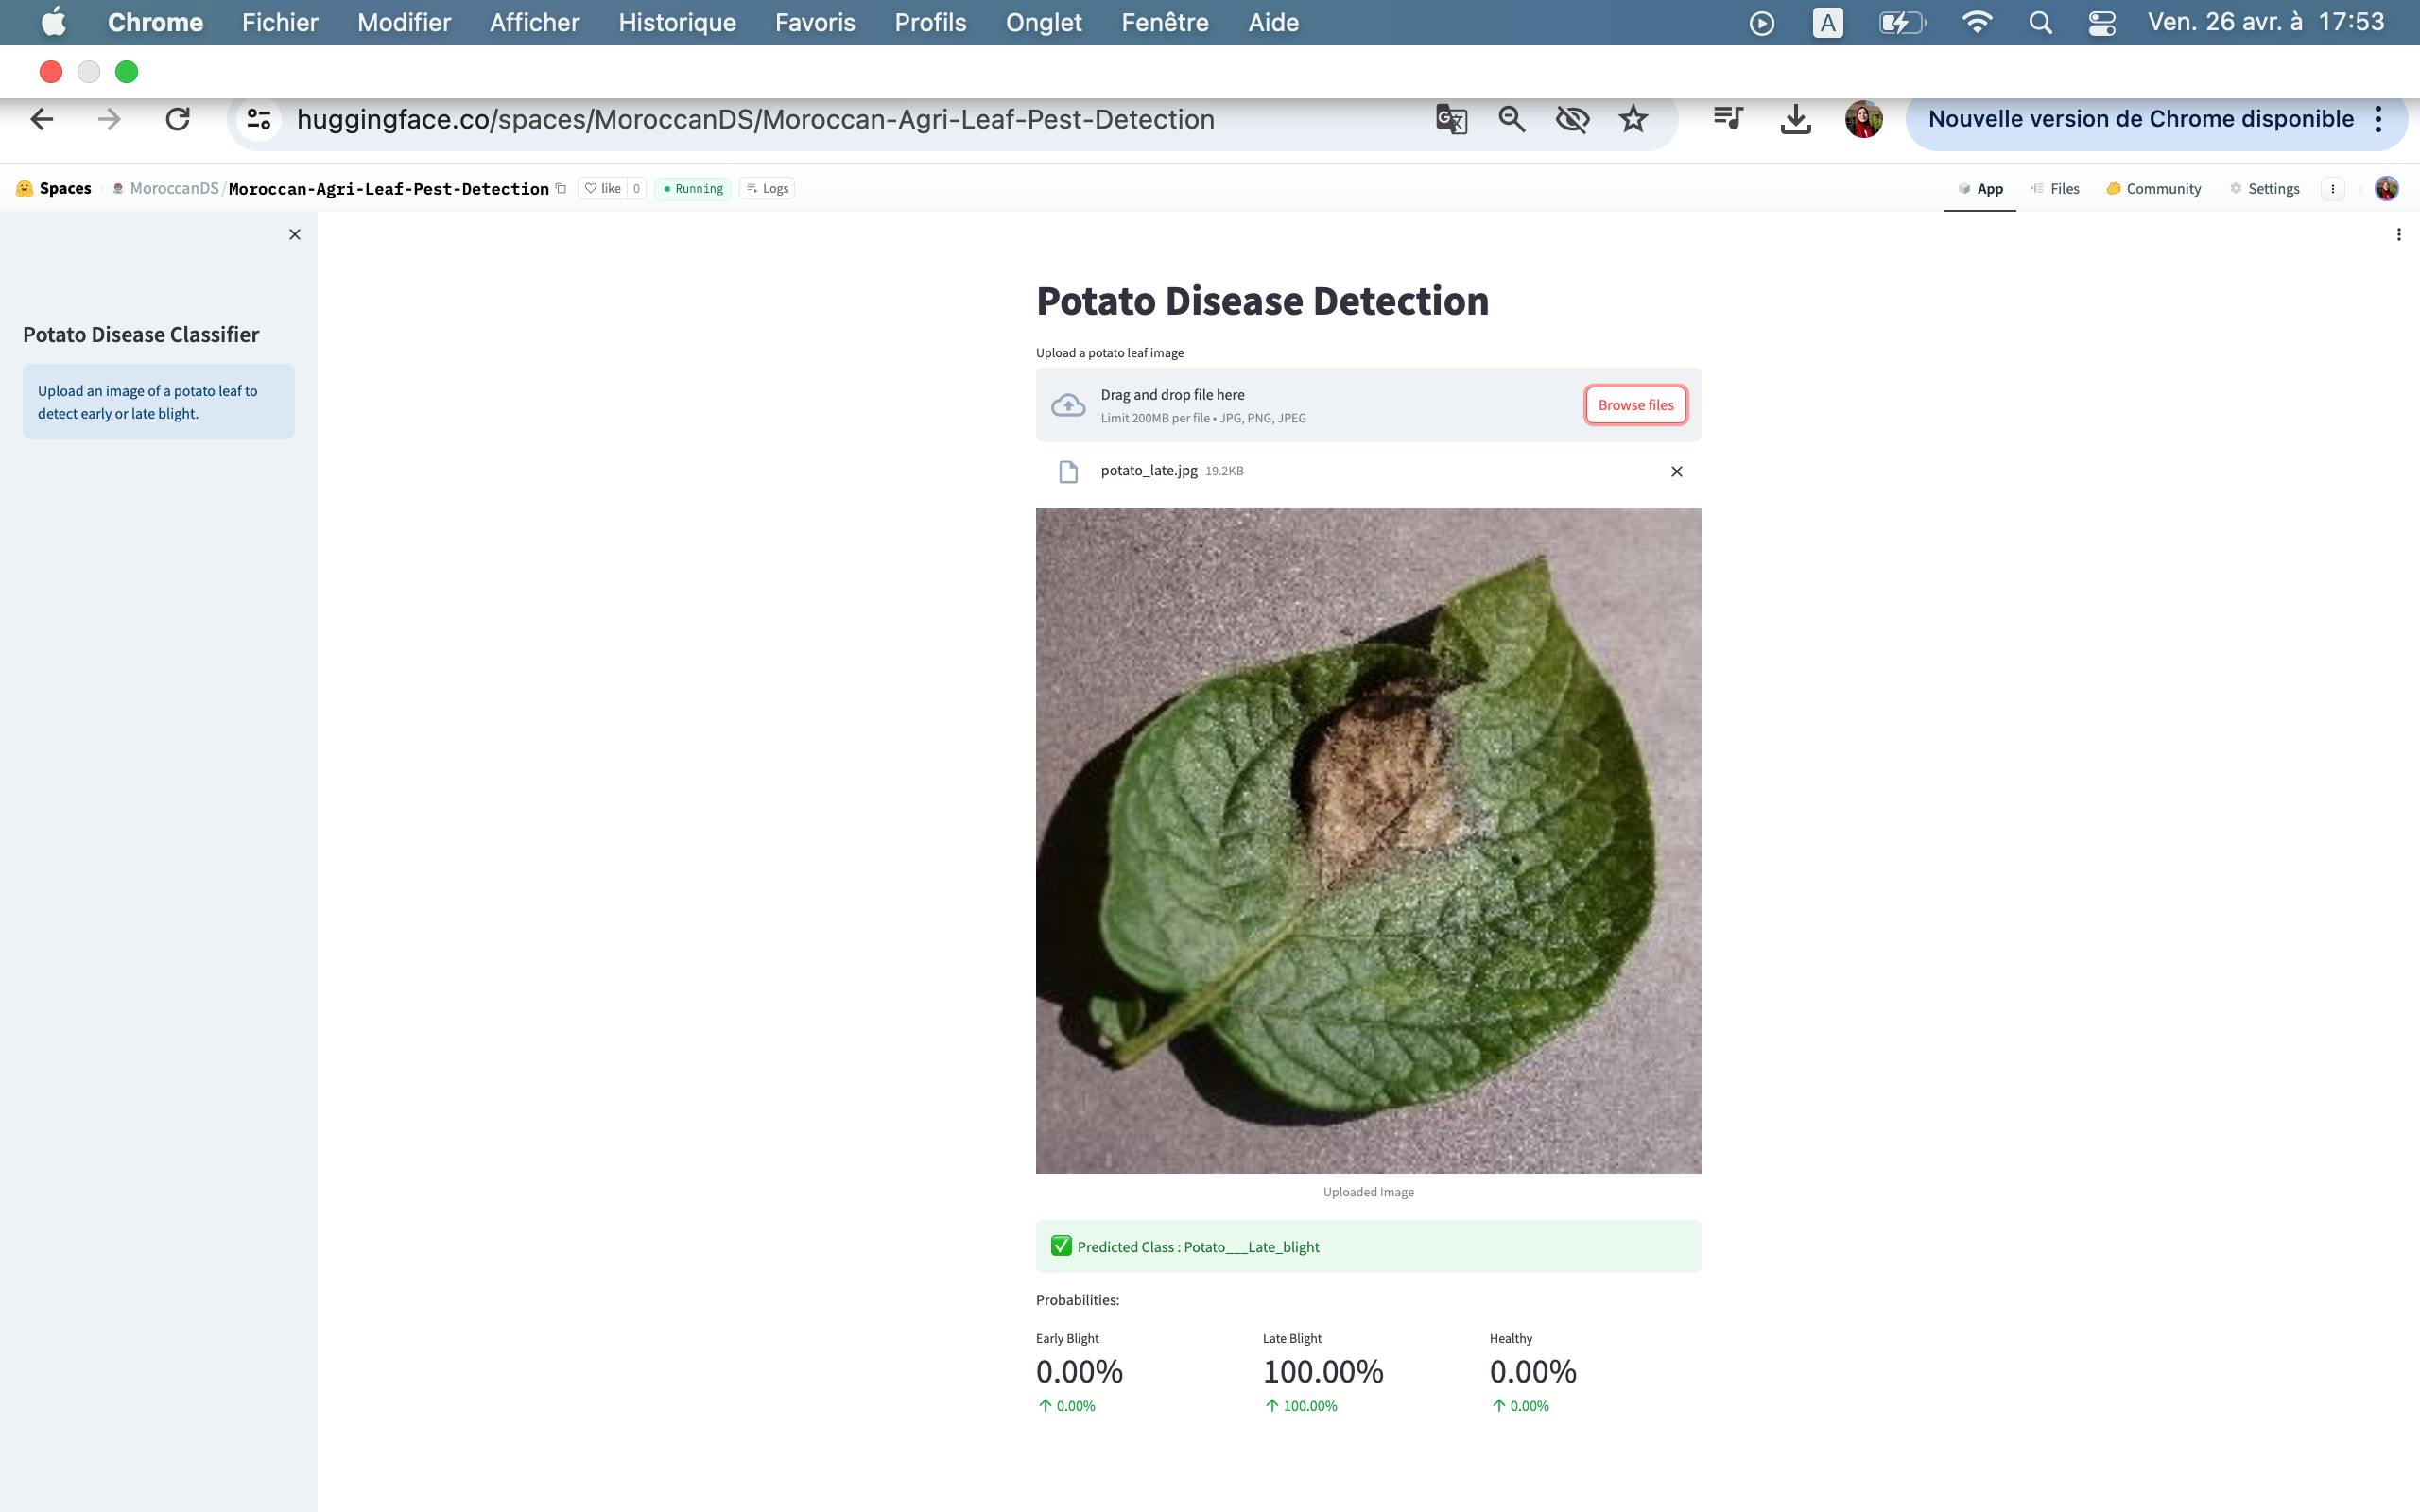
Output :
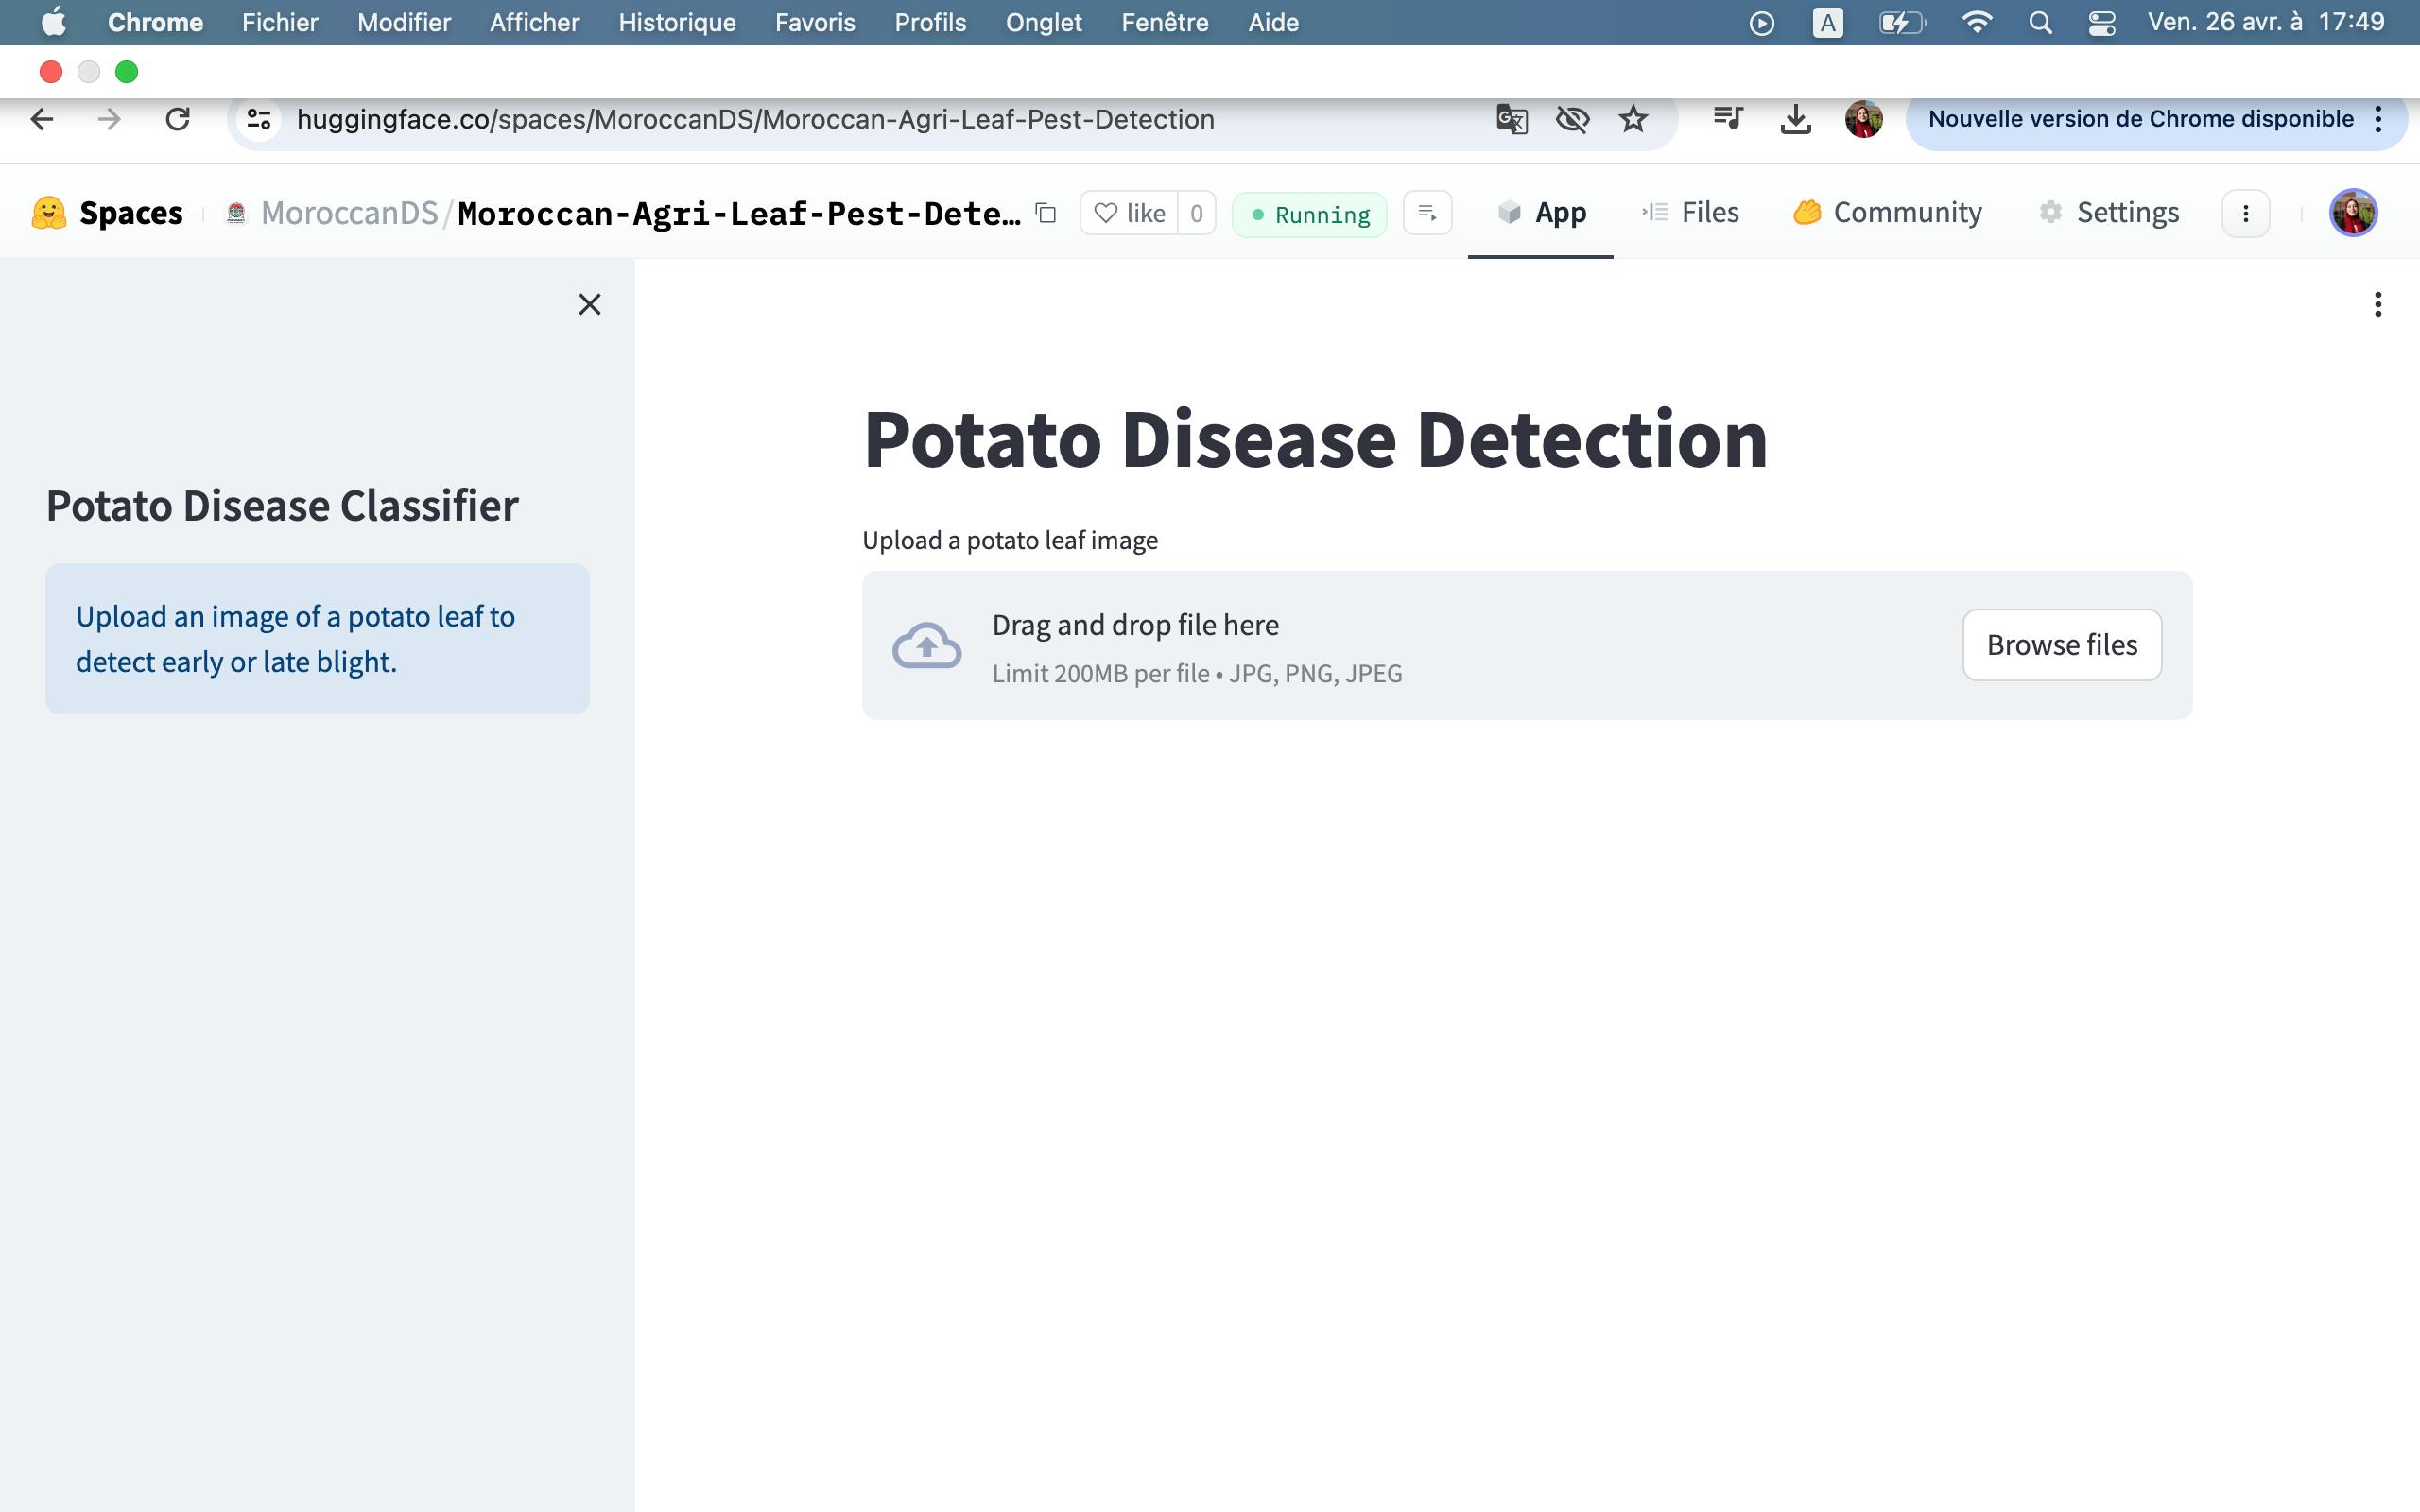
Internally, the web app uses our previously developed deep learning model to detect potato leaf diseases.
Potato early bright
Potato healthy
Potato late blight
Conclusion
As we conclude this chapter of the Moroccan Agriculture Management System project, we're reminded of the impactful results that collaborative efforts, like those facilitated by the MDS community, can achieve. By harnessing data and technology, we gain insights into societal trends and cultural phenomena, enabling informed decision-making, community engagement, and positive social change.
Moving forward, let's continue embodying the spirit of collaboration, curiosity, and inclusivity that defines the MDS community. Together, we'll persist in exploring, innovating, and inspiring, shaping a brighter future through data science and community-driven initiatives.
Acknowledgments
I Want to express my heartfelt appreciation to my dedicated team members Nizar Sahl, Idriss EL HOUARI, Farheen Akhter, Ben alla ismail, and Aicha Dessa. Their expertise and commitment have been invaluable to this project. Your hard work, collaboration, and enthusiasm have truly made a difference. As the team leader, I am incredibly proud to have worked alongside such talented individuals.
I also want to acknowledge Bahae Eddine HALIM, the founder of the Moroccan Data Science MDS Community for providing the platform for our project through the "DataFtour" second Edition initiative. His dedication to fostering a supportive environment for data enthusiasts in Morocco has been instrumental in our journey. Lastly, we thank the broader data science community for their support and encouragement, which have motivated us to push boundaries and continuously strive for excellence.
a glimpse at a sneak peek of our project:
You may connect with me Linkedin also follow me.
Thank you ✨🧠🌱